


The Crazy Story Of The Silver To S&P 500 Ratio, Prepare For A 75x Revaluation
And something wild is going on with PSLV, and not with any other silver ETF.


Something Whacked Out is Going on With PSLV
What in the name of silver is going on here? Check out the crazy volume in PSLV. Nothing like this is happening in other silver ETFs as far as I know.
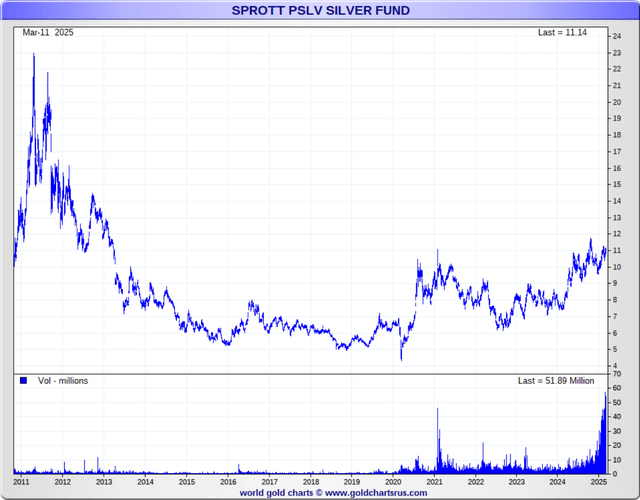
With the help of my daughter who has fully functional cones, I was able to determine from the chart below that PSLV has not added any appreciable amount of silver to its stores since this volume spike that began in late 2024.

My guess is that borrowed shares of PSLV are being traded, so volume gets magnified, sort of like fractional reserve. This could lead to an intense squeeze in PSLV if silver climbs significantly from here, and would probably magnify the effect across other ETFs as well.
The whole situation in silver looks to be very precarious. But in today's world, what isn't?
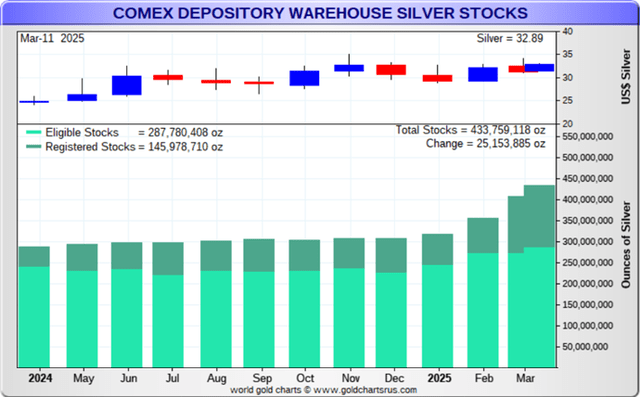
Is Comex Directly Draining LBMA Silver?
Gold is coming into New York from Switzerland mostly, with London as the exchange mechanism. Silver, however, seems to be draining physically from London to New York directly. Back in November, Comex had 312Moz. By February it was about 410M. That's a gain of 98Moz.
At the LBMA, silver stocks stood at 856.64M in November. As of February, they are 722.175M. That's a loss of 134Moz.
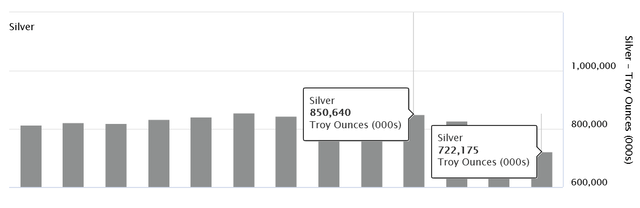
So it's not all coming from London, but a lot of it seems to be.
Gold to S&P 500 Breakout
We have a breakout in the gold to S&P 500 ratio.
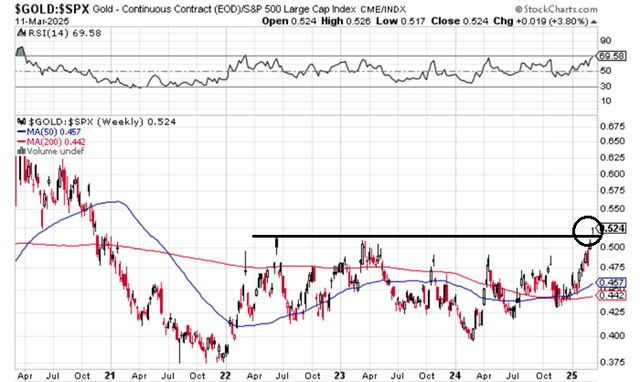
We have a very long way to go in terms of stocks losing value relative to money.

The top from 1980 is actually 7.9, from historical data I was able to find. So, from about August 1976 to January 1980, stocks fell in gold terms from 1 to 1/8th of an ounce for an S&P unit. The whole move took only 3.5 years. The 2008-2011 move was nothing by comparison. This move coming up should be like the late 1970s, except instead of starting from 1, we're starting from about 0.5, or twice as low. That means if we get to the 1980 ratio high, and I expect we will in an End Game scenario, we're talking about twice the move of 1976-1980 relative to stocks.
Rather than seeing that as silver gaining twice the value, I prefer to see it as stocks losing twice as much as they did back then.
Overall, assuming a repeat of the late 1970s, people's stock portfolios will be cut by about 94% relative to gold, and all that purchasing power will flow to stackers.
For the silver to S&P 500 ratio, the story is so much crazier.
Keep reading with a 7-day free trial
Subscribe to The End Game Investor to keep reading this post and get 7 days of free access to the full post archives.