


Is Today The Day The Bond Market Breaks?
Check Out This Key 10Y Yield Chart Back To 1925, what it has to do with today, and watch out for a hot CPI print at 8:30am EST.

10Y yield chart going back to 1925 suggests the bond market is about to be taken to the woodshed and beaten. (What else are woodsheds for anyway?).
A hot CPI report could blow the lid on long term bonds today.
Yen back in breakdown mode as trendline from 2021 remains intact.
Rubino correctly sees the end game as unstoppable. I add that $10,000 gold will not be enough, unless the printing stops right now, which it won't.

Yields Are Key Now
Today could be a big day today for long term yields. The CPI report is due today and expectations are 0.2% monthly and 2.6% annual for October. Core is expected at 0.3% and 3.3%. Long term yields are already jumpy and signaling they want to move up, and a hotter than expected CPI report might send them high enough to normalize the 10Y-3M yield spread.
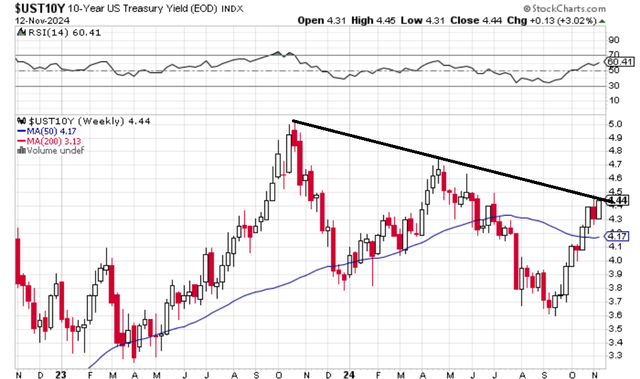
On a technical basis, 10Y is again resting up against the downtrend line. The breakthrough could be today.
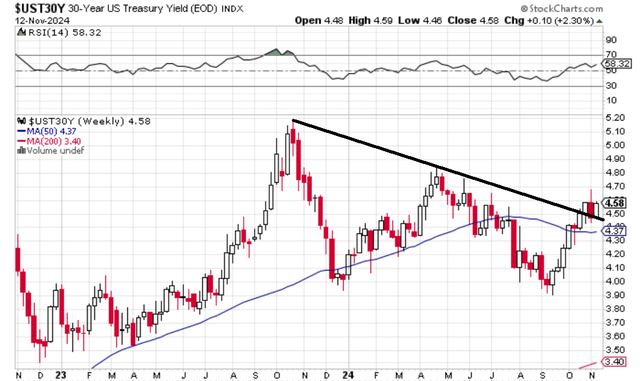
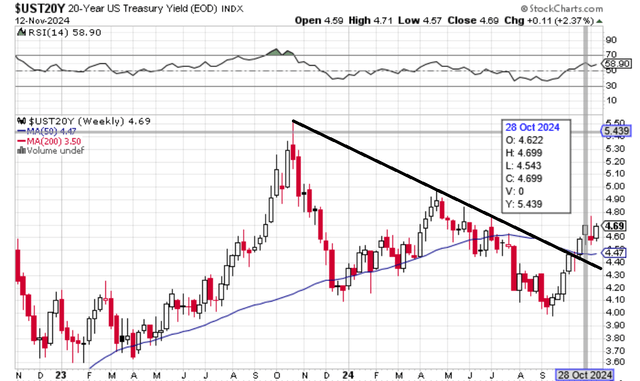
20Y and 30Y yields are already seeing the downtrend line as support now, indicating the 10Y will follow shortly.
Here's the 20Y:
The Very Long Term Technical View
I had a thought pop into my head to check the very long term 10Y yield chart and I found something intriguing.
Keep reading with a 7-day free trial
Subscribe to The End Game Investor to keep reading this post and get 7 days of free access to the full post archives.