


First Weekly Golden Cross Vs. Stocks Since 2001 As Gold Pulls Away
Yen goes back to crashing, RRPs hit new low, and the ticks on the End Game clock get louder.


Gold vs S&P 500 50WMA moves above 200WMA first time since 2001, which marked the start of a 10Y bull market of gold vs stocks.
Gold breaks out in real terms, 1959 dollars, as noted by Dr. John Hartnett.
This breakout in gold looks like it could be similar to the 2019 breakout, which lead to the 2020 crunch, so maintain caution here.
Yen back to crashing, and RRPs find now low.
Long term rates climb since rate cut, meaning demand for long term US debt is falling. Another end game puzzle piece.
In honor of the Sukkoth holiday and Shmini Atzereth tonight, this post is free. חג שמח!
Finally. The gold 200WMA is 0.4410, and the 50WMA is .4411. The 50WMA has climbed above the 200WMA for the first time since 2001 (excluding the lockdown period). The last time we had one of these, it signaled the start of a 10 year bull market vs stocks.

This time it's not going to take 10 years, and when people realize gold is beating their portfolios, they're going to panic in to money and panic out of stocks, especially as price inflation gets worse. At that point gold goes from "inflation hedge" to "if you don't have it now your nest egg is dead".
Dr. John Hartnett on Gold's Breakout in Real Terms
EGI subscriber, physicist Dr. John Hartnett has done some great work on tracking gold's real price, as opposed to its inflated dollar price. He notes several important things in his piece here:

This is gold priced in real terms (1959 dollars), where we see a breakout of a triangle going back to 1981. The 1981 tangent line is where gold balanced out Fed liabilities by 100%. In 1980 it overshot to 130%. That was a gold standard in effect. Since then we've been in a descending triangle, which only just broke out to the upside. Below is John's chart above, close up:

The breakout occurred in February this year, after one final struggle at the $42.22 line, which just happens to be the statutory price set by the Fed on its balance sheet. John notes:
I have drawn that statutory price of gold on Chart 2 using line (3). Interesting isn’t it that the price break out from the resistance line (1) occurred just as the real price of gold approached the official statutory value of $42.2222/oz.
Silver is in an even more depressed state, same methodology here. The trend line has been broken to the upside, but it's still below the base of the triangle.

Silver has a very, very long way to go to meet the 1980 target. It will be about as quick as 1980, just more extreme. Below is the close up of the breakout.

It Looks like the 2019 Breakout in Gold, Which Was Followed by the 2020 Crunch
In 2019, gold broke out from a 6 year trading range. Excitement was in the air. Volumes spiked, open interest peaked at 800K, an all time high by far, and then came March 2020 and scared the crap out of all stackers. The breakout occurred at the horizontal line below, $1,450, and retested that line in the panic. There is going to be one final panic. Be emotionally ready for it. It should be only a few months away at most.

RRPs hit a new low of $238B
We're at a new low in RRPs. Lori Logan, on the Federal Reserve Board, spoke about RRPs last week, and said that everything's fine because the spread between interest on reserves and private repo rates, is still below zero. When the spread goes above zero, it means that there aren't enough dollars to satisfy repo requirements, and rates have to go higher than interest on reserves in order to attract the required cash. That's what happened on September 30. Logan says:
“One sign liquidity remains in abundant supply, and not merely ample, is that money market rates continue to generally run well below IORB [the interest rate the Fed pays the banks on reserves]. The tri-party general collateral rate (TGCR) on repos secured by Treasury securities has been averaging 8 basis points below IORB [currently at 4.82%]. Because reserves and Treasury repos are both essentially risk-free overnight assets – and reserves are, if anything, more liquid – the spread of IORB over TGCR indicates reserves remain in relatively excess supply compared with other liquid assets.”
However, look at the graph and you can see that the spread is getting very wobbly of late. You can see that until early 2023, the spread had a ceiling of -0.1%. Then -0.1% was the floor, until around June when it no longer ever reached that low. The problem with Logan's theory is that the trouble is going to occur suddenly. There will be no warning. One day the plumbing will just clog and the Fed will be in emergency mode.

Logan sees no problem with end-of-month digestive problems in the pipes. She wants to let it happen. She says:
“Such temporary rate pressures [like September 30] can be price signals that help market participants redistribute liquidity to the places where it’s needed most. And from a policy perspective, I think it’s important to tolerate normal, modest, temporary pressures of this type so we can get to an efficient balance sheet size.”
That's not going to work. Some pressure point is going to hit and trigger a cascade. Futures positions that borrow repo funds to meet margin calls will be forced to close overnight, knocking other funds out of other positions and so on. Logan is talking about a lit match inches away from a tanker of napalm and saying it's fine because the match is, like, really small so don't worry about it.
Yen Back to Crashing

My thesis of weaker yen with higher Japanese yields continues to hold water. The yen is crashing again (red line higher) as 10Y Japanese bond yields head back up. The yen is back down to 153 from 139 only 6 weeks ago, more than half of the yen rally wiped out in 6 weeks.
Long Term Rates Higher After Rate Cut – Is There Precedent for This?
Some commentators are noting the odd movement in long term treasury yields. They started heading back up since the 50bp rate cut. See below: Red line is the fed funds rate, blue line 10Y yields.
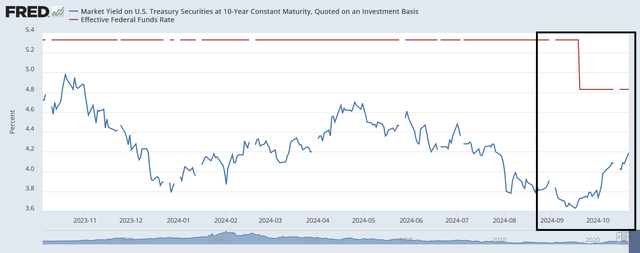
Has this ever happened before? I'd need to do a much closer inspection, but doesn't seem so at this resolution. Long term rates have always headed lower with the fed funds rate (see below), not higher. If they're headed higher now, it's a sign of lower demand for US debt, another end game puzzle piece falling in to place.

The rising long term treasury yields are pushing the 10Y-3M yield spread closer to normalization. The spread has moved 45 basis points higher since September 30, and it is currently at -40 basis points. In three weeks, the inverted yield curve could normalize.
Hello Rafi,
Thank you again for another excellent post, of course I realise that your limited in what you can say if you are in a war zone. But what’s the mood of the Israeli people, and do they feel a war with Iran is imminent, also are they behind Benjamin Netanyahu's push to defeat Iran. Seems to me Israel’s war with Iran is one of the final pieces in the puzzle of the end game, the other is the BRICS meeting.
Thank you for your free post
Hey Rafi have you seen the markets today? [dumb question] Does the Nasdaq and S&P always follow the other exactly like it is today[10/23/24]? Does the PPT [from Regan 1980’s] also cover/protect the Nas and S&P, or just the DOW? Also do you think an exhaustion of any functional liquidity is imminent? In other words, the End Game is happening right now?
PPT link, in case someone reading does not know about PPT [you obviously do :) of course] https://en.wikipedia.org/wiki/Working_Group_on_Financial_Markets