


Fed's Annual Report is Out. It Shows $1.06 Trillion In Losses. Yawn.
Here's how those losses become realized and force hyperinflation.


Treasury’s Bank Account Down to $350B

The Treasury's cash pile is now down to $350B. The most recent drop of $25B from the day before is due not to direct spending, but to T-Bill redemptions not counteracted by T-Bill auctions, due to the debt ceiling which is forcing the Treasury to cut down the size of T-Bill sales. So we might see an acceleration from here in the drainage of the account.
In any case, that's $327B spent in 5 weeks and 2 days, since April 30 when the last of the tax day loot came in. $327B is about as much as bank reserves have gone up since the same date, meaning the money being spit out of the Treasury's bank account is padding bank reserves and contributing to repo liquidity. Notice the difference in bank reserves from April 30 to now below:

Notice, however, despite this climb in bank reserves the repos to reserves level has stayed constant since April 30th at around 81.5%. Chart below of the ratio.
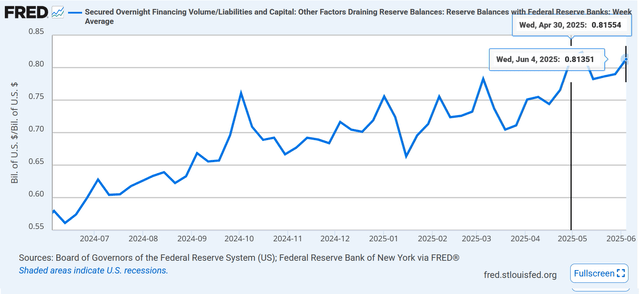
In other words, though bank reserves are being padded by government spending into the banking system, steadily increasing repo volume is sucking up all those extra available bank reserves coming from the Treasury’s bank account. Meaning, when the government starts sucking dollars out of the banking system again so it can spend more dollars on a bunch of crap, the repo market is not going to be able to adjust downward and the Fed will have to step in and feed it or die.
Gold and Silver Stockpiles in London Up in May
Gold tonnage is up 0.73%, and silver 2.22% since last month. The LBMA is exaggerating though when it (I think smugly) states "Both gold and silver stocks in London continue the upward trend."
Yeah, "upward trend". Sure. I guess you could stretch it and say gold stockpiles have been in an "upward trend" at LBMA since 2018, but to say that for silver is ludicrous.

Junk Silver Premiums Fall below 5%
The latest rally in silver prices is not translating into the retail physical markets. At least not yet. Premiums for junk silver have fallen as the spot price has risen. Still, we are not in the situation we were in during the 2010-2011 silver rally when premiums actually went negative, and it was cheaper to buy a coin than a futures contract or an ETF. That was nuts. That’s not happening now.

There is still demand for coins on the retail level. It's just very muted right now. Premiums for even the highest demand coin, the perennially overpriced silver American Eagle, is also near record lows but not quite at the 2010-2012 level.
Gold coin premiums are also relatively low, but not as low as silver right now. For silver to really go nuts, the physical and derivative markets need to be in sync. We’re not there yet, but we’ll get there.
Furious Record Breaking Volume in Platinum Futures Continues
Keep reading with a 7-day free trial
Subscribe to The End Game Investor to keep reading this post and get 7 days of free access to the full post archives.